Let Salesforce-Einstein "Google" the insights in your Data
Einstein Analytics, formally known as Wave Analytics connects data from multiple sources in an easy and convenient way that can be explored to uncover various insights without worrying about building any of the mathematical models. Salesforce Einstein Analytics empowers Sales representatives, Marketers, and Analysts with these insights to make customer interactions smarter.
In this article we will start with the fundamental concepts and building blocks of Einstein analytics platform such as Dataset, Lenses, Steps, Measures, Dataflows, Recipe etc. We will then look into different ways of bringing data from Google Analytics.
What is Google Analytics all about?
Google Analytics is a web analytics service offered by Google that tracks and reports website traffic, currently as a platform inside the Google Marketing Platform brand (Source:Wikipedia). It helps you understand how people use your sites and apps, so you can take action to improve their experience. Discover what Google Analytics can do by checking out the features listed here
Why integrate Google Analytics with Einstein Analytics?
If you happen to visit the feature list shared above then this question should be obvious. Why bother bringing data from Google Analytics into another Analytics platform when we already have all the powerful analytics feature available there. Okay, so imagine you own a monthly online magazine with multiple teams comprising of Authors, Editors, Marketing individuals, Ads team, Approval team etc. each working on different pieces of the portal. The executives need a one-stop shop to get a 360 degree view of all thats happening in the portal; viz.
... whats the revenue for say the article published by XYZ author under ABC category last month. How much money was spent for advertising the news article. Is there a similar article in progress being reviewed by the editorial team. If Yes then do we need to push the approval team to publish the article sooner for a better expected ROI.
These kind of insights are possible if we have all our data in one place. And so if you happen to be using Salesforce to manage the Marketing process, the Authors, the Employees, Finance stuff etc. then it makes much more sense to also pull in the magazine/site analytics data and get more intelligent insights with Einstein Analytics. Before we jump into exploring various options of doing this let's take a quick look into the features of Einstein Analytics.
Different Components of Einstein Analytics
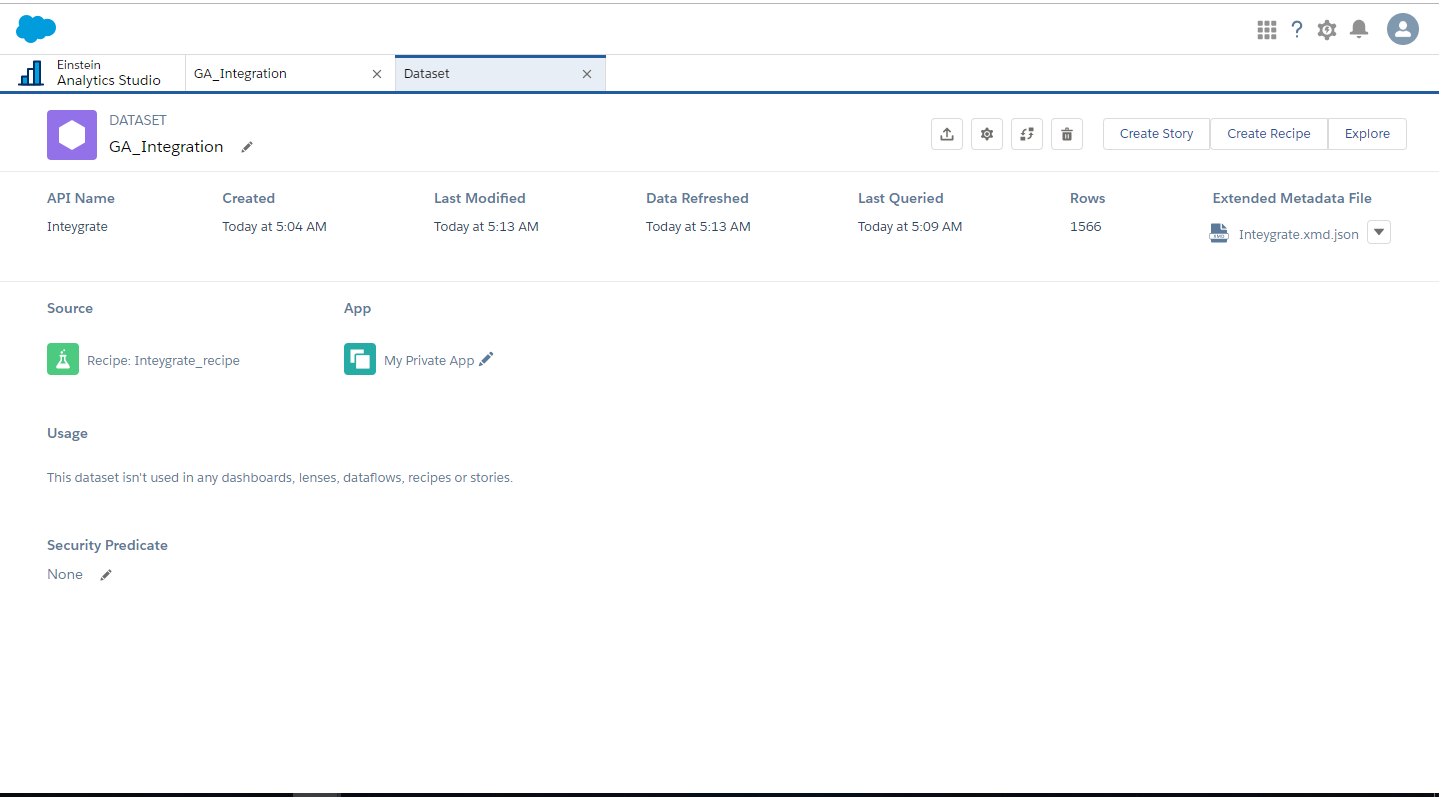
Dataset - A Dataset is a set of specially formatted source data, optimized for interactive exploration. We can import data from different sources like CSV files, Salesforce data, External Data, etc., into einstein analytics using dataset. And we use dataset to create lens.
Lens - A Lens is a visualization of data in a dataset. We use the lens to explore data graphically and they are the building blocks for dashboards. Einstein Analytics provide simple point and click functionality to add lens to the dashboard. It is important to note that lenses become steps once they are placed on a dashboard. When it becomes steps they are able to interact with other steps on a dashboard. It can be saved and shared independently.

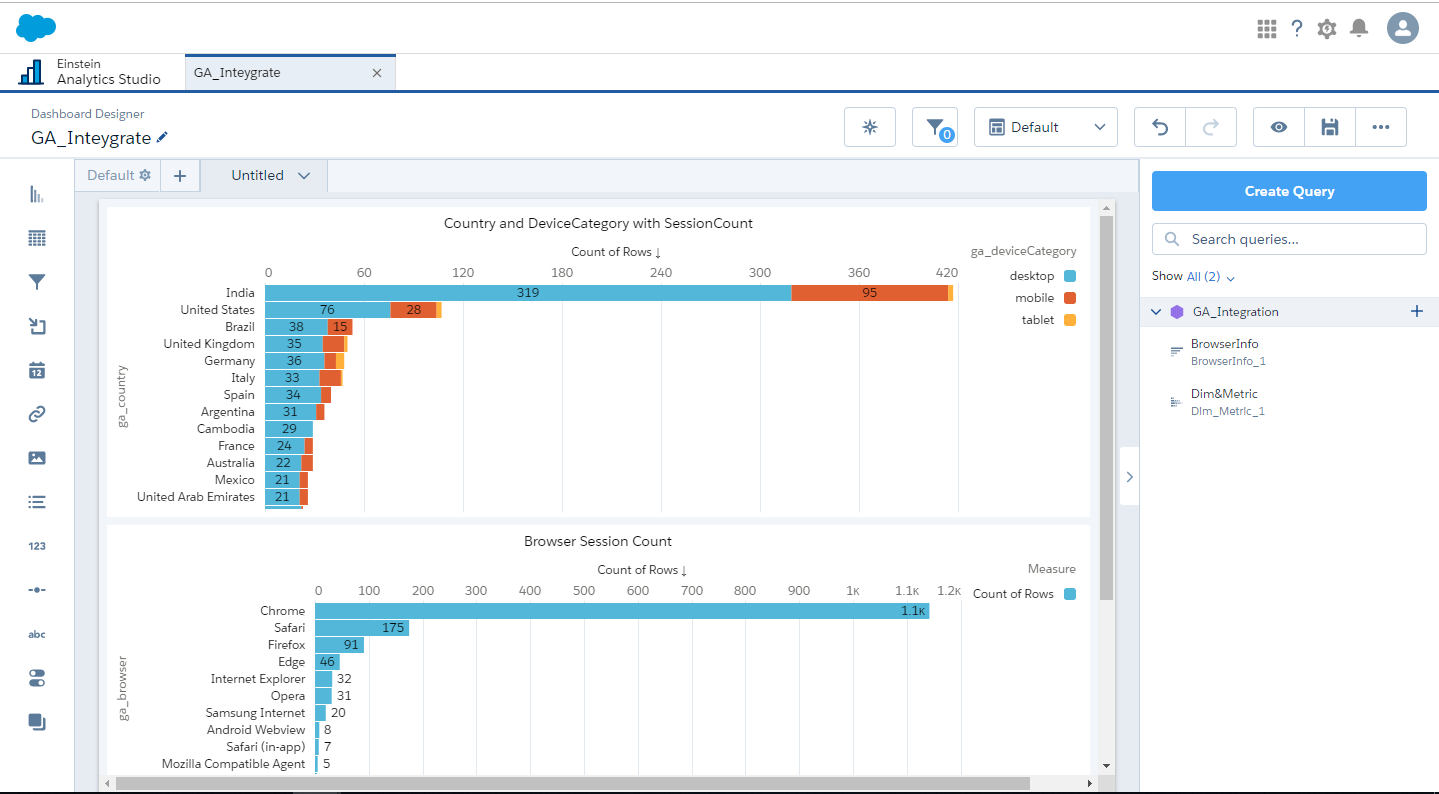
Dashboard - A Dashboard is an interactive collection of widgets that show query results from your data, whether that data comes from inside or outside Salesforce. Dashboards tell a multifaceted story about your business from different angles. The Analytics dashboard isn’t just a static picture, it invites you to dig deeper into the underlying data. You explore dashboards by clicking displayed elements. Every chart shows an interactive picture of a filtered database query.It’s easy to filter data displayed in the dashboard by selecting from drop-down lists, switching toggles, and clicking in charts. View details in tables, drill in, and take action. You can also use dashboards to collaborate with colleagues and to set goals for yourself. Track activities of sales, service, marketing personnel. Collect, analyze, and distribute insights to your team. By putting all your data sources together into a single view, Analytics makes it easier to create new data-based strategies to increase business.
App - An App is a purpose-built set of analytics and answers about a specific area of your business. After creating dashboards, lenses, and datasets, organize apps to present dashboards in relevant order, and then share apps with appropriate groups. There are prebuilt App's which have ready made datasets, lenses and dashboards built with your existing Salesforce data.
Dataflow - A Dataflow is a set of instructions that specifies what data to extract from Salesforce objects or datasets, how to transform the datasets, and which datasets to make available for querying. There are different transformations which we can add to the dataflow definition file to configure the dataflow. The dataflow definition file is a JSON file that contains transformations that represents the dataflow logic. We can also Schedule the dataflow to run to keep the datasets up to date. Let's see brief description about various transformations i.e.
- digest - Use this transformation to extract data synced from local Salesforce org, or data synced through an external connection.
- edgemart - Use this transformation to reference a dataset so that its data can be used in subsequent transformations in the dataflow. It gives access to an existing , registered dataset, which can contain Salesforce data, external data, or a combination of the two.
- computeExpression - With this transformation we can add derived fields to a dataset and the values for derived fields are not extracted from the input data source. Analytics generates the values using a SAQL(Salesforce Analytics Query Language) expression, which can be based on one or more fields from the input data or other derived fields.
- augment - This transformation adds columns to a dataset from another related dataset. The resulting, augmented dataset enables queries across both related input datasets. When you create the transformation, you identify each input dataset as the left or right dataset and specify the relationship between them. Analytics combines all the columns of the left dataset with only the specified columns from the right dataset.
- sfdcDigest - This transformation generates a dataset based on data that it extracts from a Salesforce object. You specify the Salesforce object and fields from which to extract data. When you upload the dataflow definition file, Analytics validates access to Salesforce objects and fields based on the user profile of the Integration User. At run time, Analytics runs the dataflow as the Integration User.
- sfdcRegister - This is the final transformation which registers a dataset to make it available for queries. Users cannot view or run queries against unregistered datasets.
Data Recipe - A Data Recipe is a user interface tool that allows you to combine data from multiple datasets, bucket the data, add formula fields, and cleanse the data by transforming field values. You can remove fields and filter rows that you don’t need before you create the target dataset. When you create a recipe, you specify the transformations, or steps, that you want to perform on a source. We can schedule a recipe to run at a regular interval to keep target dataset up to date. When you run the recipe, it applies these transformations and outputs the results to a new target dataset.
Jobs and Monitoring - A Monitor in the Data Manager tab is used to track the progress of syncs, dataflows, recipes and other data jobs that you run.
Different ways of Integrating Google Analytics with Einstein Analytics
There are different ways of integrating data into analytics. The tool you choose to load your data depends on your data source. You can load data from Salesforce objects with a dataflow, or load external data from a web-based data warehouse service with a connector. You can also load external data directly from a .csv file or from Microsoft Excel.
In order to bring data from Google analytics into Einstein Analytics we have the below 3 options:
Export and import CSV
It is a manual process and useful if it is for just one time.
Google Analytics Connector
Einstein Analytics provides default connector to bring data from google analytics. Below are steps describing the steps to get the JSON key file from GCP (Google Cloud Platform) followed by a small demo of the configuration in the connector.
Steps to generate the JSON credentials Key file in Google Cloud Platform:
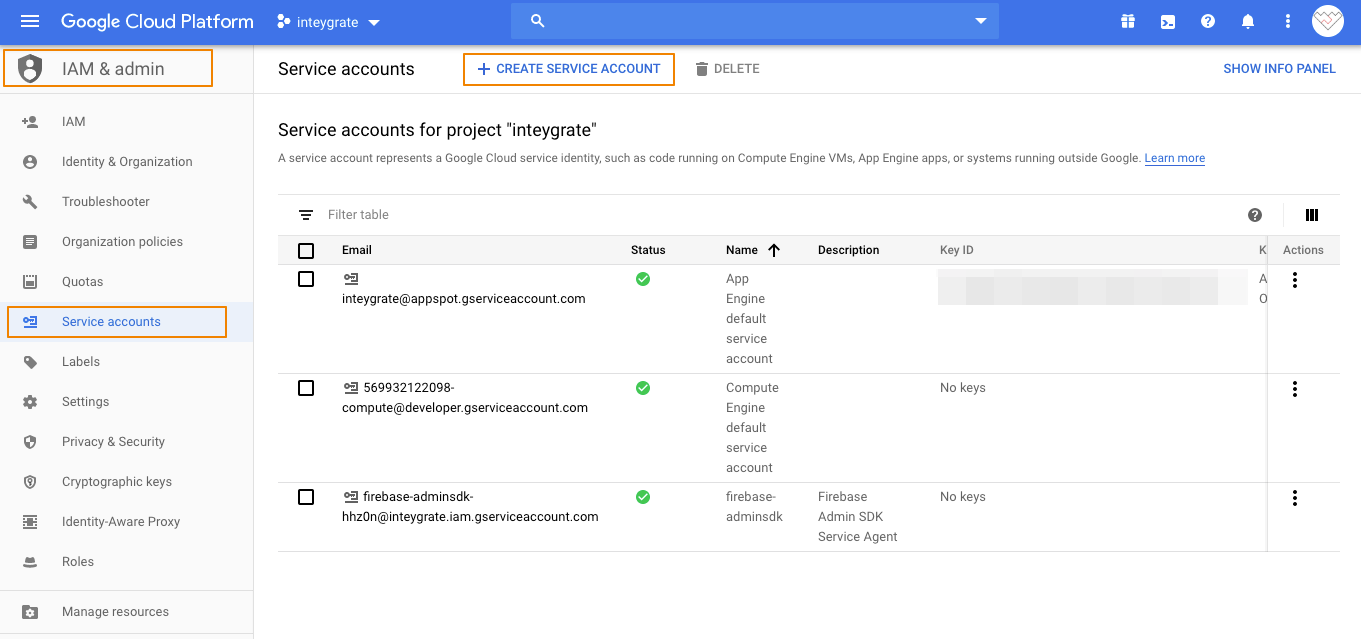
- Login to the Google Cloud Platform and under Service accounts section of IAM & Admin click Create Service Account
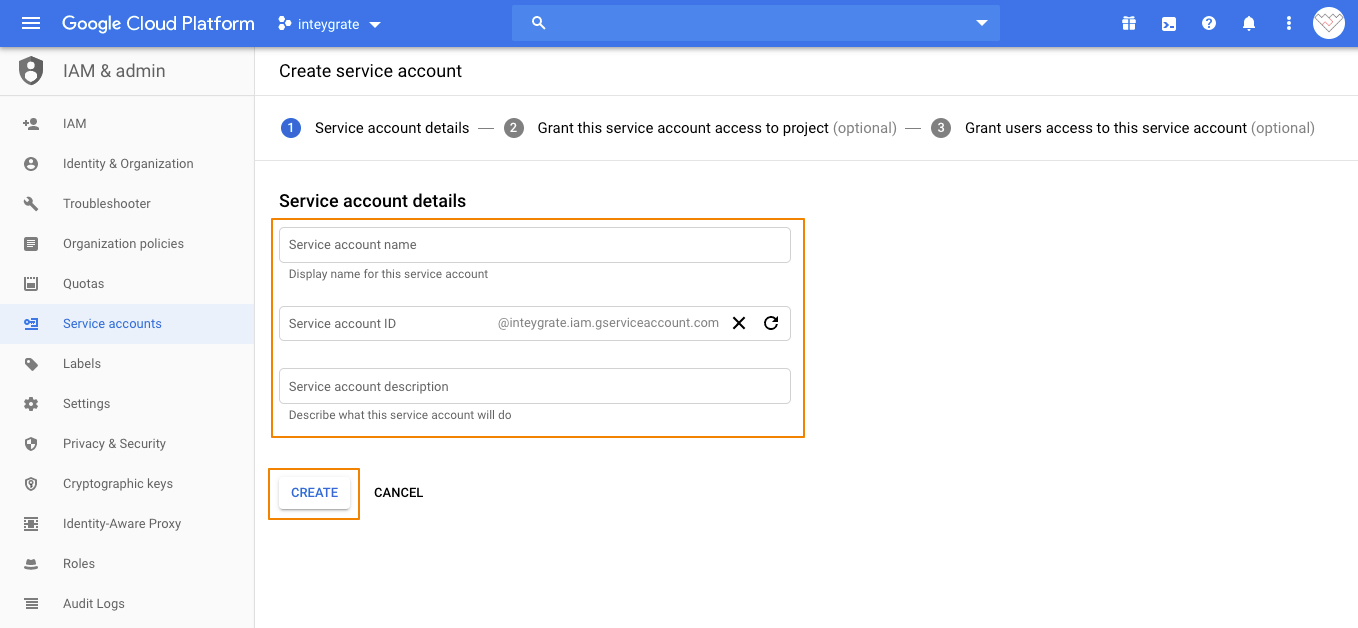
- Fill in the highlighted fields with relevant information and click Create.
- Once the Service account is created under Actions column click the 3 dots followed by Create Key
- Select JSON for the Key type and click Create
- In the downloaded Key file is the
client_emailthat should be added under Users Management of Admin section in Google Analytics to allow the Service Account access the Google Analytics Data. - The
private_keyfield value will be used in the Google Connector configuration
Enable Google Analytics API in Google Cloud Platform
- In addition to the above configuration we also need to enable the Google Analytics API in Google Cloud Platform. Under APIs & Services click Enable APIs And Services
- Search for Google Analytics API, open it and click Enable
Demo of Google Connector configuration in Einstein Analytics
You can get the View ID from your Google Analytics account under View Settings in Admin as shown below:
Custom Integration
Google Analytics provides Java, PHP and Python wrapper code which can expose data via Analytics Reporting API. In the subsequent section we will see a simple python code that can be hosted on Heroku to expose the service as web api using Flask framework.
Below is the PYTHON code for Service Accounts which uses FLASK framework
"""Hello Analytics Reporting API V4."""
from flask import Flask, render_template, jsonify
from apiclient.discovery import build
from oauth2client.service_account import ServiceAccountCredentials
from pathlib import Path
app = Flask(__name__)

SCOPES = ['']
VIEW_ID = 'XXXXXXXX'


def initialize_analyticsreporting():

  """Initializes an Analytics Reporting API V4 service object.
  Returns:
    An authorized Analytics Reporting API V4 service object.
  """

  KEY_FILE_LOCATION = Path(__file__).with_name('client_secrets.json')
  credentials = ServiceAccountCredentials.from_json_keyfile_name(
      KEY_FILE_LOCATION, SCOPES)
   """Build the service object."""
  analytics = build('analyticsreporting', 'v4', credentials=credentials)
  return analytics


def get_report(analytics):
  """Queries the Analytics Reporting API V4.
  Args:
    analytics: An authorized Analytics Reporting API V4 service object.
  Returns:
    The Analytics Reporting API V4 response.
  """
  return analytics.reports().batchGet(
       body={
        'reportRequests': [
        {
          'viewId': VIEW_ID,
          'dateRanges': [{'startDate': '2019-08-01', 'endDate': '2019-08-31'}],
          'metrics': [{'expression': 'ga:sessions'}],
          'dimensions': [{'name': 'ga:country'}]
        },
        {
          'viewId': VIEW_ID,
          'dateRanges': [{'startDate': '2019-08-01', 'endDate': '2019-08-31'}],
          'metrics': [{'expression': 'ga:sessions'}],
          'dimensions': [{'name':'ga:deviceCategory'}]
          }]
      }
  ).execute()


@app.route('/')
def hello_world():

  analytics = initialize_analyticsreporting()
  response = get_report(analytics)
  headDimArr = []
  metricValueArr = []
  finalArr = []
  count = 0
  for report in response.get('reports', []):
    columnHeader = report.get('columnHeader', {})
    dimensionHeaders = columnHeader.get('dimensions', [])
    metricHeaders = columnHeader.get('metricHeader',     {}).get('metricHeaderEntries', [])
    for row in report.get('data', {}).get('rows', []):
      dimensions = row.get('dimensions', [])
      dateRangeValues = row.get('metrics', [])
      print('Date Range Valus:', dateRangeValues)
      for header, dimension in zip(dimensionHeaders, dimensions):
        headDimArr = headDimArr + [(header, dimension)]
        print (header + ': ' + dimension)
      for i, values in enumerate(dateRangeValues):
        for metricHeader, value in zip(metricHeaders, values.get('values')):
          metricValueArr =  metricValueArr + [(metricHeader.get('name'), value)]
          print (metricHeader.get('name') + ': ' +value )
  for a, b in zip(headDimArr,metricValueArr):
    finalArr = finalArr + [(a,b)]
    count = count + 1
  return jsonify(finalArr)

if __name__ == '__main__':
  app.run()
The JSON file client_secrets.json and View ID are same which we used in connector example.
Test the python code once by running it as shown below. If there is an error please verify the path to the client_secrets.json file is correct and/or view id is configured properly.
Follow the below steps to deploy the code to Heroku and expose the functionality as Web API
Create a Heroku account. Click here to sign up for free account
Create an app and configure the build-pack as heroku/python.
Clone this app to the local repository with the below command and add the Analytics.py python code in the local folder.
Make sure that your machine has Python, Heroku CLI and GIT installed
Install Flask, gunicorn libraries using pip tool.
Initialise the GIT repository with following commands
Execute the below command to detect and get the dependencies updated in the requirements.txt file.
Create a file with the name Procfile in the root folder of the app and add the following content:
web: gunicorn "PythonCodeFileName":app --log-file -
Example:
web: gunicorn Analytics:app --log-file -
Deploy the app to Heroku with the following command
First login to Heroku using command prompt
If your browser is already logged in to Heroku , click on Log In button displayed on the page.
Once you initialise the GIT repository, do a Git push to Heroku remote and open the app in a browser with below commands:
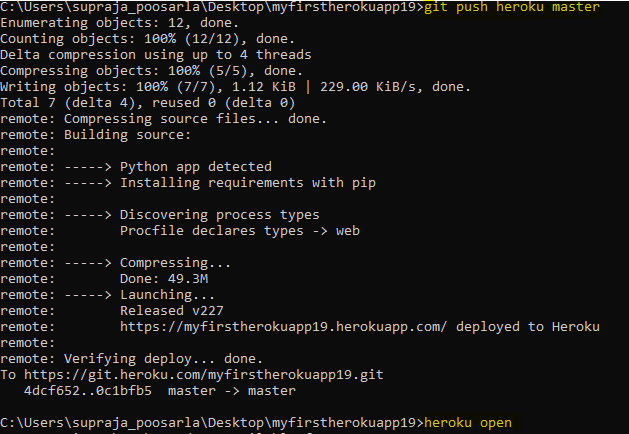
If everything was configured properly then the response should be a JSON text as shown below
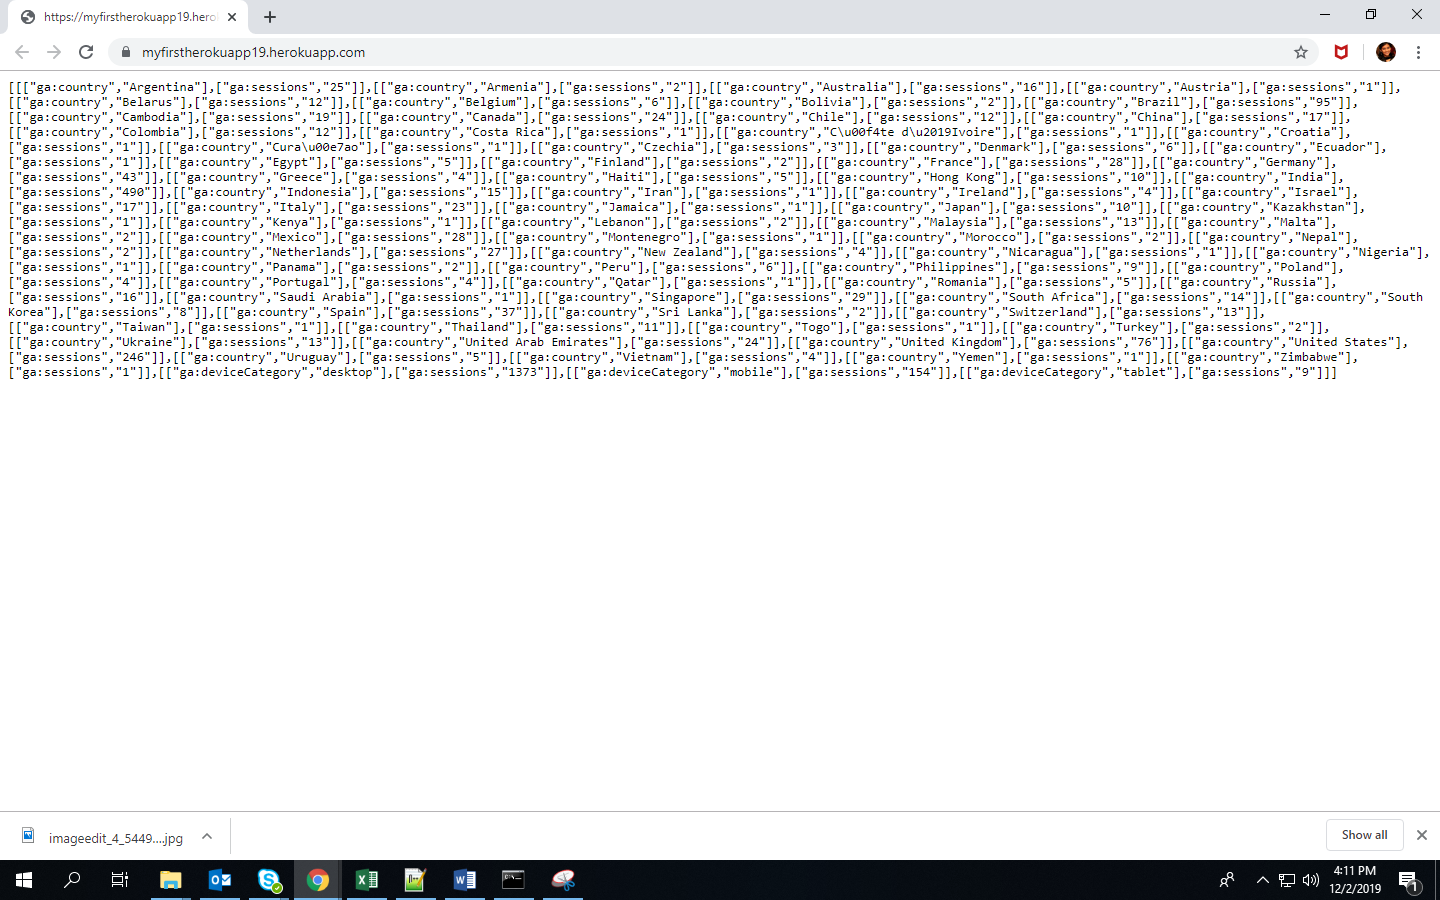
Now that we have the code that can extract data from Google Analytics using the Reporting API; available as API, we can use this in our Apex code in Salesforce and have the analytics data available in Einstein Analytics. Below is a sample callout code and following is the response from our Heroku app.
HttpRequest request = new HttpRequest();
HttpResponse response = new HttpResponse();
Http http = new Http();
request.setEndpoint('');
request.setMethod('GET');
try{
    response = http.send(request);
    System.debug(response.getBody());
}catch(System.CalloutException e) {
    System.debug('Callout error: '+ e);
    System.debug(response.toString());
}
The code samples that we have shared doesn't take into consideration the authorisation. Adequate shared key concepts and/or oAuth implementation should be implemented so that only the intended recipients can consume the API
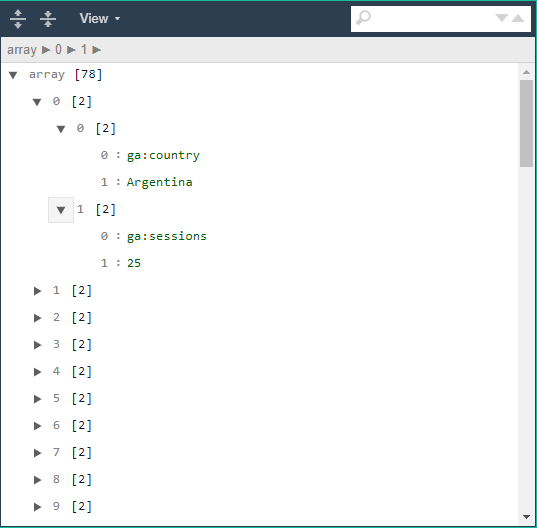
Below is the preview of the JSON response. Unlike any typical key:value pair this response from Google Analytics is a collection of nested-collections where 0th index is the key and 1st index is the value. The parsing logic hence needs to be written accordingly
Article Cover Photo Credit Andrii Leonov